Definition of Demography and Population
Subject: Social Studies

Overview
Demography

Population is the total number of people residing in a certain area. Demography is the systematic and scientific study of human population. Population and study make up the two words that make up demography. Lbn Khaldun was the first to conduct studies in the area of demographics (1332-1406). Achille Guillard originally used the term "demography" in his 1855 work "Elements destatique human on demographic comparative," also known as Comparative Demography. He created the word Demography by combining the Greek words "Demos" and "Graphia." "It is the science that studies the quantity of individuals," he stated in a brief statement.
The term "demography" comes from the Greek word "Demographia," which combines the words "Demos" and "Graphia." Demos means "people" or "individuals" in Greek, while graphia refers to the discipline or science of writing, describing, drawing, or recording. In this sense, the interpretation of the two Greek terms has to do with studying, learning about, or gathering data about people. Demographics is the science that studies the human population. A mathematical study of population size, texture, distribution, and change is known as demography.
Beginning in 1662 A.D., John Graunt began to research demography for the first time. In his publication, "Natural and Political Observation Made Upon the Bills of Mortality," he conducted an analysis of the mortality data gathered in various Church of Britain locations. This is seen as marking the beginning of the study of populations. He is therefore referred to as the father of demography.
Demography was defined as follows in 1959: "The study of demographic events, such as marriage, birth, death, and migration, is known as demography. It also examines population density, geographic distribution, population texture, and how these factors evolve over time."
Below is an explanation of demographics in both its narrow and broad senses. Since Narrow Demographic Meaning and Definition:
In a narrow sense demography is formal demography. Formal demography is defined by many scholars and institutions as:
According to U.N. Multilingual Demographic Dictionary "Demography is the scientific study of human population, primarily with respect to size, their structure, distribution and their development."
- UN, 1958
According to Shryock and Siegel, 1976 "Formal demography is concerned with the size, distribution, structure and changes of population.
- Shryock and Siegel, 1976
The science of analyzing the size, growth, distribution, texture, and structure of the human population can be summed up by saying that demography is the study of these factors.
Broad meaning of Demography:
Demography is the study of populations in a macro perspective. Both qualitative and quantitative facets of the human population are studied. Population studies deal with more than just demographic variables; they also research macro-demography. In a multidisciplinary manner, it investigates qualitatively and quantitatively the variables that have an impact on social, economic, political, environmental, hereditary, psychological, and population statistics.
- "Population studies is concerned not only with population variables but also with the relationship between population changes and other variables such as social, economic, biological, genetic, geographical, and the like," Shryock and Siegel wrote.
- According to Lorimer Frank; population studies include both quantitative and qualitative aspect of human life.
Population

"Total counting of people living inside the country or the state." - Nepali Comprehensive Dictionary
The population of a location is the total number of individuals, families, or groups of people residing there at any given time in that country's territory. It comprises males, women, seniors, individuals with disabilities, workers, etc. The population's makeup, composition, and functioning lay the groundwork for the nation's future economic, social, and cultural development. The nation bears additional burdens due to poor population management, which significantly improves development opportunities.
The populace contains the nation's hidden past, present, and future. The objective of national development is accomplished through the proper management, mobilization, and care of children who are the nation's property, senior citizens who are endowed with experience and knowledge, and young people who are capable and determined. The size, composition, and distribution of the population are significantly influenced by birth, death, and migration.
Characteristics of Nepal's Population:
- Majority of children and adolescents
- More elderly persons
- Falling but still high fertility rate
- Maternal and infant mortality rates are increasing but decreasing.
- A shorter average life expectancy
- Gender disparity
- Internally unmanaged migration
- Population distribution that is uneven
Skilled Human Power:
The whole population of local residents who work in whatever capacity to support their families financially is referred to as skilled human power.
Difference Between Population and Skilled Men Power
| Population | Skilled Manpower |
| 1. Total population in a particular area. | 1. People who can make money in a particular area. |
| 2. It encompasses everyone, including children, elderly individuals, and persons with disabilities. | 2. It excludes older individuals, those with disabilities, kids, etc. |
| 3. It is reliant on a populace that is active. | 3. The populace is independent. |
| 4. A huge population is bad for a country. | 4. A nation benefits from having a broad pool of skilled labor. |
| 5. Population control is the main goal of family planning. | 5. Increasing the number of skilled workers is the goal of family planning. |
Population Management
Planning, organizing, controlling, and guiding the population in a nation for long-term political, economic, social, cultural, and environmental sustainability is known as population management. Distribution and control of the population in accordance with the allocation of natural resources and other resources is the responsibility of population management. For the operation of the ECO power, Human power, and Techno power in any country, population management is crucial.
Importance, Need and Justification of Population Management:
- Keeps development, the environment, and the people in balance. a sketch for proposed development
- To make available the nation's talented human resource for development
- To maintain the accuracy of vital registration records, such as those for birth, death, settlement, marriage, and divorce.
- Replace unsafe settlements in order to maintain a secure and integrated settlement system.
- Must continue developing the infrastructure in accordance with the demographics.
- Scientifically maximizing the utilization of natural resources
- To place a focus on population education and sustainable methods of population management.
- To be prosperous economically.
- To end inequality, unemployment, and poverty.
Opportunities Available for Population Management:
- The right of women to procreation is listed as a basic right in the Nepalese constitution.
- A population policy for 2071 is created and put into effect,
- Ending poverty and hunger is a primary objective of sustainable development, along with promoting high standards of health.
- The Fifteenth Plan places a high premium on issues like population control and human resource management.
- The inclusion of population education in the curriculum at the school level.
- Maintaining demographic advantages with 56.96% of the population between the ages of 15 and 59 in the labor force.
- To be given the chance to aid in the nation's social and economic growth. expansion of population management-related healthcare.
- Utilization of family planning resources has increased.
- Educating people about the value of a small, content family.
Measure to Solve Population Problem:
- To create and carry out a suitable population policy.
- From elementary school to graduate school, population education must be successfully incorporated into the curricula.
- Maintain national economic progress in areas including transportation, industrial output, and agricultural production.
- Promote family planning and make more family planning tools available for free,
- Promote initiatives like those for maternity care, child health, and reproductive health.
- Expand the idea of a tiny, content family.
- Enforce strict legal restrictions on open borders.
- Keep up diplomatic relations to help with the refugee issue.
- Manage unauthorized migration,
- Place a focus on female employment
- Get rid of evils, social issues, and superstition
Population Composition According to Sex and Age
Population composition is the breakdown of the entire population in a given area by factors such as age, sex, religion, occupation, ethnicity, mother tongue, and level of education.
Sex-wise Population Composition
The composition of the population according to sex is when a nation's population is divided into male and female groups based on sex. In this way, the gender makeup of any region or location's population can be determined by counting women and men separately. The following table illustrates the gender breakdown of the population of Nepal.
Sex-wise Population Composition
| Census Year | Male | Percentage | Female | Percentage | Total |
| 2058 B.S. | 11563921 | 49.9 | 1587502 | 50.1 | 23151423 |
| 2068 B.S. | 12849041 | 48.5 | 13645463 | 51.5 | 26494504 |
Nepal had a total population of 2,64,94,504 people as of the most recent national census, with 1,28,49,041 men and 1,36,45,463 women (a combined 51.50%). The sex ratio is 94.16 males for every 100 females.
Population by Broad Age Group
According to the census of 2068 B.S., the population of the country in the 15- to 59-year-old age bracket made up 56.96% of the entire population. The population of children under the age of 14 made up 34.91% of the total population, and the elderly made up 8.13%. Children's population declined and senior citizens' population climbed in a comparison study between the 2058 and 2068 censuses.
Population Pyramid
The term "population pyramid" refers to the graphical representation of population distribution by age and sex, from level zero to level one, in a particular design. This is a method of streamlining the description of the population. Following is a basic explanation of the different population pyramid types:
- Type I (Expansive): This particular pyramid has a triangular shape with a broad base and a sharp upward angle. This pyramid is found in nations like South Africa, Sudan, Kenya, Ethiopia, and Somalia where epidemics and infectious diseases are more common, mortality rates are higher across the board, and fertility rates are higher.
- Type II (Constrictive): Children's and other people's life expectancies rise in developing nations when deadly epidemic diseases like malaria and plague are avoided, skilled medical personnel are hired, and medical infrastructure is improved. In developing nations like Nepal, India, Sri Lanka, and others, where both birth rates and mortality rates are decreasing, this type of pyramid can be seen.
- Type III (Stationary): This particular pyramid has a narrow base, a wide middle, and then a narrower upper portion. Low fertility and death are indicators. The average lifespan of a person is higher. It alludes to the world's developed and highly developed nations as a pyramid. Japan, the UK, the USA, and so on are a few examples.

Image Source: National Census 2068 Brief Results (Secretariat of the National Planning Commission, Central Statistics Department, 2069)
Population Density:
The total number of people living in a given area per square meter is known as population density. Nepal has a population density of 180 people per square kilometer. Currently, there are 1381 people per square kilometer in urban areas and 153 in rural areas, making urban areas much more populated than rural areas. Manang district had the lowest population density (4416 per sq km), while Kathmandu district had the highest.
Demographic Transition and Pattern of Population Growth since 2007 B. S.
Demographic Transition
The term "population change" refers to a shift in the population of a location over an extended period of time. Positive or negative population change is possible. Population size increases when population change is positive, and it drops when population change is negative. Birth, death, and migration are the three primary drivers of population change. Migration is an artificial component, while birth and death are the natural causes of population change. The demographics provide in-depth data on births, deaths, and migrations—the main elements that affect how populations change.
Demographic Components, Process and Measures
| Components | Process | Measures |
| Birth | Fertility | Fertility Rate |
| Death | Mortality | Mortality Rate |
| Migration | Migration | Migration Rate |
Demographic Transition Theory:
In the subject of population studies, the theory of population transition is well known as a cutting-edge, empirical theory. Unlike other ideas, this theory is founded on actual and historical population events. In actuality, this theory's structure was inspired by the experience of Western industrialized nations, yet developing countries should nevertheless value it highly.
A population revolution or a demographic cycle are other names for population shifts. It is also said to provide a thorough explanation of all patterns, from the population's high stationary state to its low stationary state. The high stationary state suggests that population growth is constant and that both the high birth rate and the high mortality rate are being maintained.
It was quite difficult to identify the person who originally explained population transition theory, but Landry did so in 1909 AD when historical evidence was taken into account. Warren Thompson is acknowledged as the creator of demographic transition theory since he later offered more theoretical support in 1929 AD. Frank Notestein revised this hypothesis in 1945 AD after Thompson. In 1947 A.D., C.P. Blacker presented the theory in a scientific manner just two years later.
In 1947, C.P. Blacker provided a scientific explanation of the transition theory. A.D. Blanker divided the demographic transition theory into five distinct stages, which we will go over in more detail below.
- High Stationary Stage: Both the birth rate and the mortality rate are high at this stage, slowing down population growth.
- Early Expanding Stage: At this point, the mortality rate is still high but the birth rate is still high, which accelerates population growth. The development in the field of public health is one of the primary causes of this. Many nations, including Nepal, India, Bangladesh, and African nations, can be said to still be in this stage of transition.
- Late Expanding Stage: Both the birth rate and the mortality rate are declining at this stage, but the quick reduction in the mortality rate relative to the birth rate maintains a high pace of population expansion. This is the outcome of the health sector's improvement and the growth of public awareness. Currently, this state is being traversed by South American nations, China, Sri Lanka, and the Maldives.
- Low Stationary Stage: In this state, as public awareness rises, people are more drawn to small, contented families, raising their living standards and having fewer children as a result. On the other hand, as science and technology advance, healthcare facilities get better and the mortality rate falls, supporting low population growth. To put it another way, reproduction and death are inversely correlated. Low stationary stages of population growth are present in nations like Australia, Austria, and Germany.
- Declining Stage: At this point, people's consciousness is quite high in some of the wealthiest nations in the world, and as women's autonomy and decision-making skills have developed, there is a tendency for individuals to have fewer children or, in some circumstances, no children at all. People are starting to regard tasks like birthing taking care of them as borning tasks as the attitude of living independently is growing, which is why the fertility rate in such countries is relatively low. Contrarily, despite low fertility rates and low death rates being maintained, the number of persons dying from old age remains steady. This is because, occasionally, the birth rate is lower than the mortality rate and the population is discovered to be on the decline. The diminishing condition is what is known as such a situation. Currently, this state is reached by more developed nations like France, Singapore, Britain, Canada, and Norway.
Assumptions of Demographic Transition Theory:
- In any population, the mortality rate declines first, followed by a reduction in the birth rate.
- The tendency of the population, together with the country's social, economic, political, and other developmental processes, is to replace historically high birth rates and high mortality with low birth rates.
Rapid population growth is defined as population expansion that exceeds the capability of available resources and means. Due to the high population expansion, the population grows greater. Following is a brief discussion of the causes, effects, and potential solutions to Nepal's population issues.
Pattern of Population Growth since 2007 B.S.
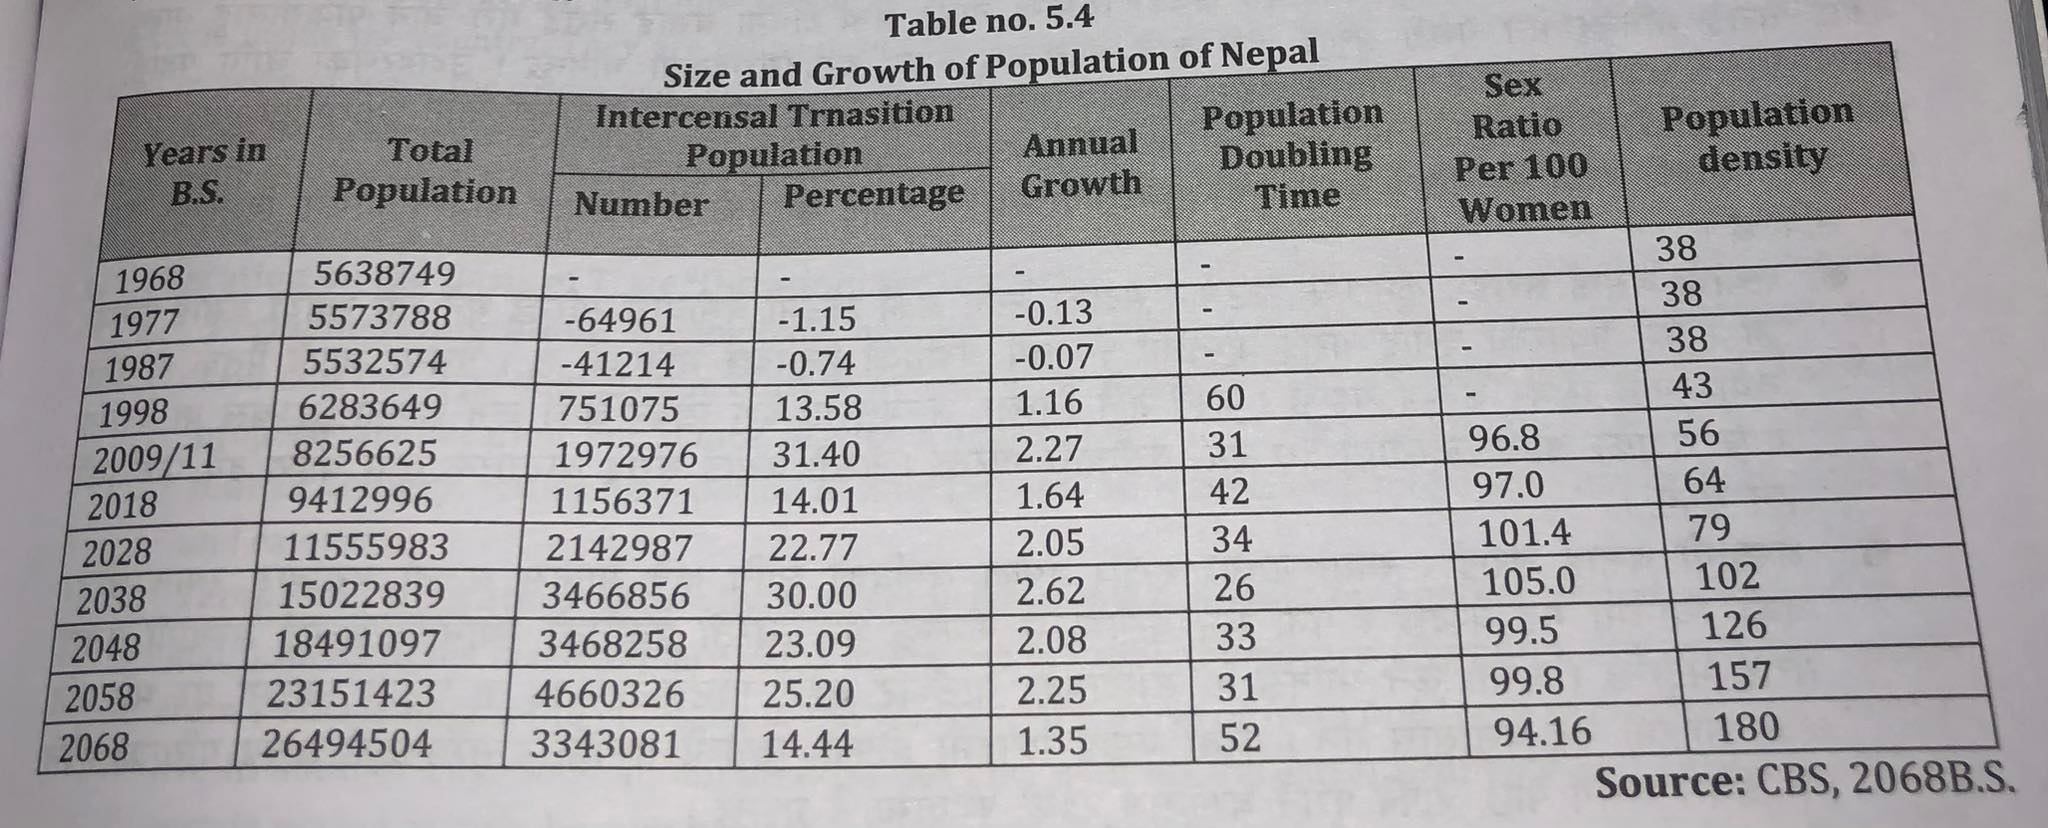
In Nepal, eleven censuses have already been completed. 1968 B.S. marked the official start of the census (1911 A.D). Since then, the census has been carried out roughly every ten years. The census taken up until 1998 B.S. was only a head count, however the census taken starting in 2009/11 B.S. (1952/54 A.D.) is regarded as a modern (scientific), comparable census. Only population vouchers were used to record the initial tally. From the population department, censuses of the population were taken after 2009–2011. After 2018 B.S., the Central Statistics Department is responsible for conducting all ensuing censuses. In 2028B.S., a computer (IBM 1401) was utilized for the first time to collect demographic data.
Annual Population Growth Rate
The yearly exponential population growth rate for the period 2058 to 1068 B.S. is revealed to be 1.35 percent by National Census 2068, which is approximately 2.25 percent of the annual population by the census of 2058. (2048 to 2058 B.S). In light of this, the National Census indicates that Nepal's population growth rate in 2068 is lower than it was in the previous census. Given Nepal's demographic situation (Table 5.3), the annual population growth rate in 2009–11 was high (2.27%), while the rate in 2068 was significantly lower.
Why is Nepal's Population Growth Rate Low?
- Youth leaving with a propensity for jobs and higher study overseas.
- Increasing the number of women in the workforce will allow them to have fewer children while they are working,
- Educating people and raising awareness
- The legalization of abortion.
- Child marriage, polygamy, and mismatched marriage are all outlawed.
- Son and daughter discrimination is declining.
- Lower infant and child death rates have contributed to low birth rates.
- Increase of traffic collisions.
- The government has created and implemented a number of strategies and policies to reduce the rate of population growth.
Migration Pattern, Causes, Attitude and Effects on Population Health
Migration
They have lived in a nomadic fashion ever since the dawn of human civilization. The world's most intellectual animal is the man. One cannot always remain in one spot because one is a dynamic entity. He moves about for various reasons, such as jobs, relationships with others, amusement, and services. To satisfy their wants and fulfill their desires, people relocate. Migration is the act of leaving one's current domicile for a variety of reasons, including political, economic, social, cultural, and environmental ones. This plays a significant role in the examination of demographics. Migration studies are essential because they have a significant impact on the composition, growth, and structure of any nation's population.
Migration is a form of spatial or geographical mobility between geographical units, typically involving a change in residence from the place of origin or place of departure to the place of destination or place of arrival, according to the U.N. Multilingual Demographic Dictionary.
Patterns of Migration
There are many types of migration in a society. Migration can be primarily studied as internal and international migration, which are split into two parts, according to demographic perspectives.
Internal Migration
Moving from one location to another inside a clearly defined geographic or political area, such as the limits of a country, is known as internal migration. Internal migration is the movement of people from one geographic or political region to another in order to dwell there. We refer to them as in-migrants. Similar to in-migration, out-migration occurs when individuals from one geographic or political region move or leave their place of origin and settle in another location inside the national boundary. For instance, if someone migrates from the Hill to the Terai under such circumstances, they are immigrants in the Terai and out-migrants on the Hill. Internal migration can also be categorized and researched using other criteria:
- Migration on the Basis of Time/Duration: We can further classify of migration on the basis of duration.
- Permanent migration: A permanent settlement is a state of perpetual movement. According to some, this kind of migration must last at least ten years. Leaving their own ancestral home and locale is part of this. For instance, relocating to another area, zone, or nation after leaving one settles for a while (at least 10 years). Migration of this kind could be internal or external.
- Temporary migration: In general, migration is referred to as transient if a person returns to his native location after leaving it for a further five to ten years. For instance, even if they currently reside in another city, people from a village may migrate to cities, from the village to the Terai, or from one town to another. His ancestors' possessions and relations are only a portion of such an abode. He returns to his former home after a given amount of time.
- Seasonal migration: It is referred to as seasonal or periodic migration when a person moves away from home and stays outdoors for around six months. For instance, Himalayan Sherpas in Nepal leave the house for six months so they can graze their cattle and engage in trade. Similar to this, individuals move from one location to another for various agricultural activities. In Nepal, some farmers work in the market when not in their fields. Each of these is an illustration of seasonal migration.
- Migration on the Basis of Place: Internal migration is the movement of people from one location to another within a country's borders. It may be ongoing, passing, or seasonal. In general, people have a tendency to move from village to city and from hill to Terai in most developing countries, including Nepal, due to various facilities, opportunities, security, etc. Location-based categories for the migration process allow for further division into different phases. On the basis of location, migration can be divided into:
- Rural to Rural Area
- Rural to Urban Area
- Hill to Terai Region
- Town to City
- Urban to Rural
International Migration
International migration is the movement of people between nations. In general, individuals migrate from developing countries to developed ones in quest of job and opportunity, while, to a lesser extent, people migrate from developed countries to poor countries for travel and trade. There are two scenarios in which international migration occurs:
- Emigration: Emigration is the process of leaving your country and moving to another one across international borders. An emigrant is someone who migrates in this manner. Any citizen who migrates does so by leaving their country of birth and moving to another. For instance, Nepalese move from Nepal to India and then immigrate to the US.
- Immigration: The process of bringing individuals into the country from another is known as immigration. An immigrant is someone who migrates in this manner. As an illustration, refugees from Bhutan and Indian immigrants both settled in Nepal. People moving to Nepal from Europe.
International migration can be divided under different basis:
- On the Basis of Time/Duration: The following categories can be used to categorize international migration depending on the time period::
- Permanent Migration: Permanent migration is the process of shifting from one nation to another. One example would be Nepalese residing in Burma. There are now hundreds of Nepalese citizens residing there permanently.
- Temporary Migration: Temporary migration is the term for moving from one country to another for a short while. This kind of movement is done for academic, professional, or other reasons. After achieving their goals, those who participate in this type of migration will return to their home country. For instance, Nepalese migrated to India, Singapore, or Britain in order to pursue their academic endeavors.
- On the Basis of Nature: Depending on the nature of migration, international migration can be divided into 2 parts.
- Voluntary Migration: Migration of this kind does not compel a person to relocate. Voluntary migration is the act of individuals moving on their own from one nation to another. For instance, relocating under the United States DV Program from Nepal to the United States
- Forced Migration: Compulsory migration is when a person must leave their home nation and relocate to another country for social, economic, political, or religious reasons. A prime illustration of this was the relocation of more than 1 crore 70 lakh persons during the partition of India and Pakistan in 1947.
- On the Basis of Legalization: Under legalization international migration is divided into three parts:
- Legal migration: The migration between the two nations is a legal settlement under the laws of any state. This allows for the transfer of the entry order from one nation to another. As an illustration, it is wise to relocate from the US to Nepal after obtaining a permit.
- Illegal migration: This relates to the practice of emigrating illegally in violation of a nation's immigration laws. This means that a person will be an illegal immigrant if they travel to another country without completing all the legal requirements to do so. For instance, to cross international borders while concealing one's location.
- Refugees: Because of suffering brought on by the nation's political system or for other reasons, refugees are forced to leave their home country and move to another. It is a particular kind of forced migration. One striking example is the high number of Bhutanese citizens who have fled to Eastern Nepal as refugees since 1990 AD.
Causes of Migration
Simply said, people don't travel aimlessly. There are two circumstances in which the process of moving people happens. The first is a compulsive condition, whereas the second is a hobby. Various factors, such as opportunities, work, security, etc., compel people to relocate. Some people travel to new locations, conduct study, and look for suitable business and commercial locations. Demographers categorize the causes of migration into push and pull variables, which can be summarized as follows:
- Push factors:
- Political factors include threats of violence, political unrest, and general insecurity.
- Economic factors include unemployment, a lack of markets, a lack of commerce,
- Social factors include social dominance, discrimination, and a lack of infrastructure and services in the areas of sanitation, health, transportation, and education.
- Natural Factors: Desertification, landslides, earthquakes, and soil erosion
- Environmental factor: increased consequences of climate change, environmental pollution, waste management, deforestation,
- Population expansion
- Providing services slowly
- Food scarcity
- Arduous rural existence
- Absence of a level, fertile location with market potential,
- Lack of space and entertainment facilities,
- Poverty, lack of resources, debt growth, etc.
- Pull factors:
- Economic factors include job prospects, trade and business operations, industry operation, participation in income generation, and support for the expansion of economic activities.
- Social factor: high standards in education, healthcare, access to clean water, and sanitation.
- Low impact of earthquakes, floods, landslides, and other natural disasters.
- Political factors: political freedom, safety and peace,
- Infrastructure includes things like roads, transportation, energy, and communication.
- Urban amenities of today and lifestyle
- No racial or gender discrimination
- Assist with the newest innovations and
- Sufficient entertainment options
- A suitable civilization, culture, and family location,
- Availability of open space with sufficient access to facilities and equipment for recreation,
- Environment that is clean, healthy, and green.
Effects of Migration
Both the place of origin and the place of destination are impacted by migration. Both positive and negative effects can be attributed to it.
Effects in Place of origin:
- Positive Effects/Consequences
- Aids in population control
- Low population density makes colonization easier.
- Increased work opportunities Population and infrastructure are in balance.
- Preservation of the environment
- A rise in the land-to-man ratio
- Not being starved
- The region's economy will advance quickly, etc., if the people who travel to the destination actually travel there and send the property they have acquired there.
- Negative consequences
- Youthful and underqualified human resources shortage
- An increase of women, the elderly, and those with physical disabilities
- Lack of labor due to employment abroad
- Reduction in economic activity
- Increase in uncultivated and barren land Uneven population distribution Fewer development activities
- Both a muscle and brain drain
- Local customs and culture disappear
Consequences in the place of destination:
- Positive Consequences
- The availability of skilled labor
- Making the most of the tools and resources that have been idle,
- Using technology, invention, and research
- Exchange of traditions and culture,
- Increase in non-agricultural sector employment
- Exchange of new knowledge, skills, and ideas.
- Negative consequences
- Inadequate opportunities and unhealthy competition,
- Health, clean drinking water, and sanitation issues
- Increase in theft, robbery, and other forms of social crime
- An increase in land plotting,
- Environmental pollution has increased,
- Non-agricultural land replaces agricultural land,
- Deterioration of traditional values and norms,
- Land-man ratio issues, uncontrolled urbanization, biodiversity losses, deforestation, etc.
Effects in population Health
The burden of population on housing, healthcare, and educational resources at the destinations has increased as people move at random. Therefore, due to unplanned residential developments, habitat problems are being produced everywhere as people walk carelessly. Pollution in the streets and lanes has increased as a result of uncontrolled building. Garbage accumulation in these places is escalating daily. Because of this, the surroundings are now inherently unhealthy. Consequently, it appears that many diseases are more likely to spread there. In a similar vein, migration is continuously concentrated in the same region, putting additional strain on transportation services due to disruptions in the supply of electricity and water. Basic health care and facilities cannot be accessed because there are no health posts or hospitals in the area.
Fertility and Mortality Rate and Its Effects in Population Growth Pattern
Determinants of Population Changes
Different demographic indicators are needed for demographic study. The numerical statistics of demographic events are provided by demographic elements. Mathematical formulas can be used to calculate these numerical values. Demographic measuring is the process of identifying various demographic rates in this way. Examples of fertility indicators include crude birth rates and total fertility rates. Like crude mortality and infant mortality, immigration rate and gross migration rate are examples of migration metrics. Crude mortality and infant mortality are examples of mortality measures. Statistics on births, deaths, migration, and information on population growth are used to calculate demographics.
Fertility
In other words, fertility is the ability of a woman to reproduce and give birth to a child. The exact number of births a woman actually has over her entire reproductive life is her fertility. Fecundity is the ability to bear children. The range of the fecundable period is 15 to 49 years. A woman is considered infertile or sterile if she is unable to conceive through regular sexual activity without the use of contraception. Below in Table No. 5.5, the distinction between fertility and fecundity is listed.
Difference between Fertility and Fecundity
| Fertility | Fecundity |
|
|
|
|
|
|
|
|
|
|
Measures of fertility
- Crude Birth Rate: Crude birth rate (CBR) is the total number of live births per 1,000 people in a given area at midyear during a given year. Calculating it is simple. It is a popular and simple way to measure fertility. The information needed to perform this computation is readily available. It is not necessary to measure any specific information. It is sufficient based on both birth rates and population size. It is known as a crude computation because it uses the entire population as its base. The population's age and gender distribution is not necessary. As a result, it cannot be utilized for fertility comparison studies. Mid-year population is required to measure the demographic rate. The CBR in Nepal is 22.4 per 1000 people, according to the 2016 Nepal health and population survey. It is calibrated in the following way.
Crude Birth Rate = Total number of live births of a particular place in certain year/The total mid-year population of the place X 1,000
Or,
CBR =B/P × 1,000
Where, CBR=crude birth rate
B = Total number of live birth in a place in a certain year
P = Total mid-year population of the place - General Fertility Rate (GFR):GFR measures the total number of live births per 1,000 mid-year females in a given area who are of reproductive age in a given year. Due to the fact that it only includes females who are of reproductive age, it is more sophisticated than a crude birth rate. GFR in Nepal is 88/1,000, according to the Nepal Health and Demographic Survey. The following is how it is measured:
General Fertility Rate (GFR) = Total number of live births in a place in a given year/Total mid-year female population of reproductive age in the place in the same year × 1000 - Age Specific Fertility Rate (ASFR): The actual number of births per thousand women of a given age or age group is known as the ASFR. Because it is based on age rather than CBR or GFR, it is more sophisticated. In Nepal, women between the ages of 20 and 24 have exceptionally high age-specific fertility rates. Women of reproductive age can be grouped at intervals of five years, or each age can be measured separately. The 5-year interval is maintained to make the study easier in general. The following table displays the results of the 2016 ASFR of Nepal's demographic and health survey.
Age Specific Fertility Rate
| Age Group | ASFR (per 1000 women) |
| 15-19 | 88 |
| 20-24 | 172 |
| 25-29 | 124 |
| 30-34 | 59 |
| 35-39 | 18 |
| 40-44 | 6 |
| 45-49 | 2 |
| Total | 469 |
Source: Nepal Demographic and Health Survey 2016
It can be measured in the following way:
- Age Specific Fertility Rate (ASFR)= Actual number of babies delivered by women of a certain age or age group who were of childbearing potential in a certain location, or the total number of women in that location who were of childbearing potential at midyear × 1000
- Total Fertility Rate (TFR): The average number of children a woman would have when in reproductive age is known as the total fertility rate (15- 49). The overall fertility rate in Nepal is 2.3 babies born to each woman, according to the 2016 Nepal Health and Demographic Survey. Compared to the other fertility rates mentioned above, the Total Fertility Rate is thought to be more sophisticated and superior. All measurements can be obtained using age-specific fertility rates (ASFR). The fertility rates of various age groups must be gathered for this (Table No. 5.5). The total fertility rate is calculated by taking the sum of the age-specific fertility rate (ASFR), multiplying by 5, and dividing by 1000. It is measurable as:
- Total Fertility Rate (TFR):
5x sum of Age Specific Fertility Rate/1000
OR - TFR= 5 × Σ ASFR/1,000
Here,
Σ ASFR=469 - Total Fertility Rate (TFR) = 5 × Σ ASFR/1,000
- Total Fertility Rate (TFR):
=5 × 469/1000
= 2.3
- Total Fertility Rate (TFR) = Each mother has 2.3 kids. Consequently, a woman has 2.3 children on average during her reproductive years.
The population growth rate remains constant if the total fertility rate of any nation is less than 2.1 per woman. A high population growth rate is considered to exist if the value is greater than 3. The 2016 Nepal demographic and health survey found that there are 2.3 babies born to each woman in Nepal. The following table illustrates the characteristics of total fertility rate.
Total Fertility Rate, 2028-2073
| S.N. | Source of Data | Year | Total fertility Rate |
| 1. | Census-2028 | 2028 | 6.3 |
| 2. | Nepal contractive prevalence survey, 1981 A.D (2038 BS) | 2037-38 | 6.3 |
| 3. | Nepl fertility, family planning and health survey, 2048 | 2046-48 | 4.8 |
| 4. | Nepal demographic and Health Survey, 2058 | 2055-57 | 3.1 |
| 5. | Nepal demographic and Health Survey, 2068 | 2065-67 | 2.6 |
| 6. | Nepal in figures (CBS) | 2072 | 2.5 |
| 7. | Nepal demographic and Health survey, 2073 | 2073 | 2.3 |
Effects of Mortality in Population Growth Pattern:
The primary natural factor influencing population shifts is thought to be birth. The population of the respective family, village, and country grows with the birth of a child. Religious and social values can also have an impact on birth. Birth and reproduction are related. The following elements affect how the population changes as a result of fertility:
Factor Affecting on Fertility
| Social Factor | Economic Factor | Environment Factor |
| Illiteracy, early marriage, polygamy, gender existence, family structure, ge of marriage and university, high infant mortality, war, status of women, etc. | Economic status, poverty, unemployment, occupation, etc. | Climate |
Mortality
Death is defined as the passing away or complete erasure of all traces of life. The World Health Organization (WHO) defines death as the end of a living thing after all signs of it have vanished forever after birth.
Measures of Mortality:
Finding the mortality metrics is necessary in order to examine the status of death. The death rates are primarily as follows:
- Crude Death Rate (CDR): Crude Death Rate is the total number of deaths per 1000 people in a location at the midpoint of a given year. Calculating and contrasting this rate is simple. This statistic is regarded as being a crude calculation because it uses the total population as the foundation for calculation even though the mortality rate varies depending on age group. The crude death rate in Nepal is 7.3 per 1,000 people, according to Population Census 2068. It is measurable as:
Crude Death Rate = Total number of death in a place in a year/Total midyear population of the place in a given year × 1000 - Age Specific Death Rate (ASDR): The total number of deaths for a certain age group per 1,000 people in that age group at the midpoint of the year is known as the age-specific mortality rate. It is a more accurate measurement than a simple death rate. It might also be measured differently for men and women.
Age Specific Death Rate can be measured as below:
Total number of death of particular age group in a year in a particular place/Total midyear population of the same age group in a year in a particular place× 1000 - Infant Mortality Rate (IMR): Infant mortality is defined as the death of a child within a year of birth. Infant mortality rate is the total number of infants under one year old who die in a given year for every 1000 live births in that location. It is among the best indicators of the nation's socioeconomic and medical conditions. It is measurable as follows:
Infant Mortality Rate= Total number of deaths under one year's age in a place in a year/Total number of live births in a year × 1000 - d. Maternal Mortality Rate (MMR): According to WHO, "Maternal mortality is defined as the death of a woman while pregnant or within 42 days of termination of pregnancy, irrespective of the duration and site of the pregnancy, from any cause related to or aggravated by pregnancy or its management but not from accidental or incidental causes."
The ratio of maternal deaths also reveals a nation's socioeconomic and health status. The 2016 Nepal Health and Demographic Survey reports that there are 239 maternal deaths for every 100,000 live births in Nepal. The number of mothers who pass away in a given year as a result of the cause of childbirth is known as the maternal mortality ratio. It is measurable as:
Maternal Mortality Ratio = Death of women due to pregnancy related cases in a year in a specific place/Total number of live births in a place in a year × 100000
Effects of Mortality in Population Growth Pattern:
Another organic component of population change is death. Population declines due to death. To lower mortality across the world, numerous attempts are made. Nepal has also taken attempts to decrease fatalities. The Crude Death Rate in Nepal was estimated by the Central Statistics Department to be 8.7 per thousand in 2063 B.S.; but, by 2068 B.S., it had dropped to just 7.3 per thousand. Infant and child mortality declines are to blame for the decline in mortality. Because couples do not have the confidence that their children will survive or not, fertility will remain high as long as mortality remains high. Therefore, they have more children because they believe that if they have many children, few will survive. The following are the elements that could alter the population:
Factors Affecting Factor
| Social Factor | Economic Factor | Environmental Factor |
|
|
|
Migration
People migrate when they relocate from one location to another. Migration is the act of people moving away from their own original homes and into new locations. People migrate when they move geographically from one place to another. Migration depends on elements like time, geography, ease of work or operation, distraction, and attraction, among others.
- Measures of Migration: The migration rate measures the total number of migrants in a country over the course of a year relative to the area's mid-year population. The measurement is:
In Migration Rate (IMR)= Total number of in-migrants to a place in a year/Total mid-year population of a place in the year× 1000 - Out Migration Rate (OMR): The outmigration rate is the number of people who moved away from the region per 1,000 of the region's total mid-year population. The measurement is:
Out Migration Rate (OMR) = Total number of outmigrants from a place in a year/Total midyear population of a place in a year × 1000 - Gross Migration Rate (GMR): The total population entering and leaving a location each year, expressed as a percentage per thousand, is the gross migration rate. The measurement is:
Gross Migration Rate (GMR) = Sum of incoming and outgoing population in a place in a year/The total mid year population of the place× 1000 - Net Migration Rate (NMR): The difference between in- and out-migration in a location at a given time is known as the net migration rate.
Net Migration Rate (NMR) = The difference of inmigrants and out migrants in a place in a particular time/Total midyear population of a place in a year x 1000
Or, NMR=(1-0)/P x1000
Things to remember title
© 2021 Saralmind. All Rights Reserved.
 Login with google