Circulatory system: Heart sound and Normal blood flow
Subject: Anatomy and Physiology

Overview
Heart Sound
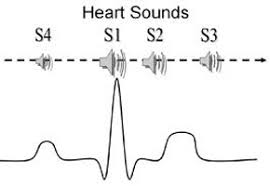
If the thorax is auscultated using a stethoscope, two distinct sounds can be detected in a healthy heart during each cardiac cycle. Auscultation is the process of listening to the noises your body makes.
It's common to refer to the first and second heart sounds, S1 and S2, as "lubb-dupp." S1 is slightly longer and louder than S2. Because of blood turbulence, S1 is brought on by the AV valves closing.
S2, the second sound, is less loud and shorter than S1. Because of blood turbulence, S2 is brought on by the closure of the semi-lunar valves.
S3 and S4 are the other two cardiac tones that a stethoscope cannot detect. The blood rushes into the ventricle during the rapid filling phase, producing the low-pitched sound known as S3. In a heart that is sick, hearing a third heartbeat (S3) is typical. The heart will beat with a triple rhythm or gallop when it is present. S4 is a silent sound that only becomes audible under pathological conditions. Atrial systole causes the atrial muscle to contract, resulting in the production of S4.
Cardiac Output
The amount of blood pumped out into the aorta (or pulmonary trunk) by each ventricle (left and right ventricles) in a minute is known as cardiac output (CO). It is created by dividing the stroke volume by the heart rate (HR) (SV). The amount of blood that each ventricle pumps out during a stroke. The number of heartbeats per minute is known as heart rate (HR).
CO = SV ml/min x HR beats/min x 1/beat
Male SV in a typical resting adult averages 70 beats per minute. Therefore, cardiac output is calculated as follows: C0 = 75 beats per minute 70 milliliters per beat = 5250 milliliters per minute = 5.251/min.
Cardiac output is not continuous; instead, it changes depending on how active the body is. When you exercise hard, your CO level can rise by as much as 21L/min.
Cardiac reserve is the difference between maximum cardiac output and that amount.
Electrocardiogram
The electrical activities of the heart are captured on an electrocardiogram (ECG). The electrical impulses generated by all the heart muscle fibers during each heartbeat are captured by the ECG. A heart rate monitor called an electrocardiograph is used to record the variations.
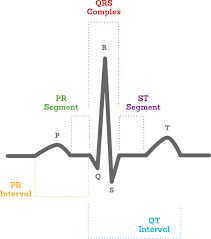
It is a device for measuring heart electrical activity. Electrodes can be positioned in a conventional location on the skin of the chest wall, extremities, and other areas to detect electrical activity. The five waves that make up a typical ECG trace are P, Q, R, S, and T. These letters, which have been given to different deflections, describe the electrographic characteristics of several cardiovascular disorders.
When the impulse from the SA node sweeps over the atrium, the "P wave" is created. It symbolizes arterial contraction or depolarization.
When the impulse from the AV node quickly spreads along the AV bundle and purkinje fibers, the "QRS complex" develops. It denotes either ventricular contraction or depolarization.
When the ventricular muscles relax, the "T wave" is created. The heart can now relax at this time. It is an indication of ventricular repolarization (resting stage).
Examining the wave patterns and time intervals between cycles, which reveal the condition of the heart's conducting system and mitochondria, yields important information.
Things to remember title
© 2021 Saralmind. All Rights Reserved.
 Login with google