Variables of Scientific Research
Subject: Science

Overview
Variables are causative factors connected to events or phenomena, either directly or indirectly. In scientific research, the relationship between the size of the causative factor and the size of the effect is crucial for accurate estimation. In experiments, variables are physical quantities that change or may change. A dependent variable is a variable that cannot be directly predicted or ascertained, such as the distance covered by a piece of paper. In experiments, the independent variable is the variable that determines the outcome, while the dependent variable is the value dependent on another variable. Controlled variables, on the other hand, are variables that are controlled during an experiment to ensure the validity, reliability, and accuracy of the results.
A scientific study consists of physical conditions, experiments, theories, models, and facts. It examines a range of natural objects in a methodical and structured manner. examines the various phenomena iteratively using empirical or quantifiable evidence and scientific methods. There are numerous causes for the many events and phenomena that have occurred in nature. A variable is a causative factor, attribute, or feature that is connected to an event or phenomenon, either directly or indirectly.
Variables of Scientific Research
When we witness a phenomenon or change, we are naturally curious to learn about its causes, contributing variables, and effects. We are better able to predict the outcome of an action when we are curious. For example, we would like to know why a potted plant in the garden is wilted. Is it due to dehydration, excessive sun exposure, or something else entirely? We look for the effects of watering, fertilizing, and other actions on the plant while it is kept in the shade in order to determine the answer.
If we keep a plant in the shade on a hot day or forget to water it, we can easily guess what might happen to it thanks to the knowledge and experience we've gained from this kind of curiosity or interest. After that, we can take the required action to save it.
Every event or modification has a cause and an effect. In the previously mentioned example, wilting is the result of either too much sun or a shortage of water. The causative factors determine the effect. For instance, a plant's stem stiffness varies with its water content.
As a result, understanding the relationship between the size of the causative factor and the size of the effect is crucial for accurate estimation.Experiments can be used to establish this relationship. Establishing a relationship between different physical quantities is the job of a scientist in order to understand how nature functions.
In scientific research, one physical quantity's magnitude is changed, and the effects of this change are then observed in relation to other physical quantities. For instance, in the experiment mentioned above, we looked at how the rubber band's extension, or stretch, changed the paper bullet's travel distance. Here, the rubber band's extension and the bullet's trajectory are both physical quantities, and each experiment's results will vary in terms of their magnitude. Since their value or magnitude fluctuates over time, these physical quantities are known as variables. Variables of the experiment or research are the elements (physical quantities) that change or may change in an experiment. The variables in the experiment mentioned above are the rubber band's stretching and the paper bullet's distance traveled. In that experiment, it was also possible to alter the rubber band's thickness and the paper bullet's size. Consequently, these also constitute the research's variables.
For ease of writing, each variable has a name and a symbol that represents it. A mathematical formula is used to express the relationship between the variables. For instance, if the paper's length (e) and the rubber's extension (x) are both given, then the relation between them is x e.
Types of Variables
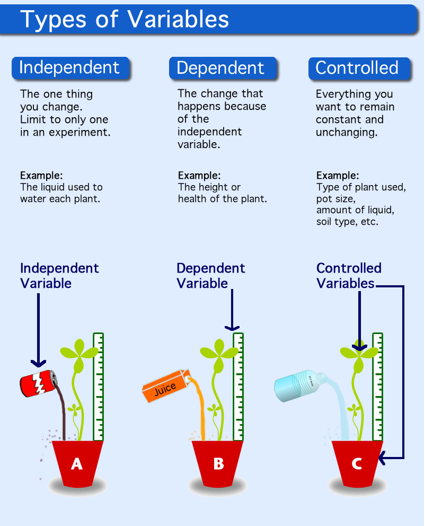
- Independent Variable
In a scientific investigation, an investigator modifies or alters a variable to a specific extent and assesses the resulting changes in a different variable. The experimenter's or researcher's modification is the causative factor, and the change in another variable that follows is the effect. A stretched rubber band throws the paper bullet into the experiment above. The distance the paper travels is the effect, and the rubber band's extension is the cause. The experimenter or researcher can freely choose the rubber band's degree of extension. The variable that a researcher can control is referred to as an independent variable. Independent variables are the experiment's causative factors. For instance, the quantity of water, sunlight, and fertilizer a plant receives can all act as independent variables in its growth.
- Dependent Variable
The researcher is unable to precisely determine the distance the piece of paper covers because the experiment depends on how much the rubber band stretches. We refer to this type of variable as a dependent variable. Hence, a dependent variable is one whose value is dependent on the value of another and whose value the experimenter is unable to directly predict or ascertain.The dependent variable in the activity, for instance, is the distance the paper bullet travels. Similar to this, when examining how sunlight affects a plant's growth and development, the plant's height or growth is the dependent variable and the quantity of sunlight is the independent variable.
- Controlled Variable
In certain studies or investigations, there might be more than two variables. Every variable affects how an experiment or study turns out. As a result, it is impossible to identify the variable that changed the findings or results. It is difficult to draw conclusions in such a scenario. Even the conclusion may not be reliable or valid. Therefore, variables other than the designated independent and dependent variables should be controlled so they do not affect the result in order to make the experiment's findings valid, reliable, and accurate. The variables that are controlled during an experiment or study are referred to as controlled variables.
Other examples of the variable types mentioned above are listed in the table below:
| S.No. | Subject of Research | Independent Variable | Dependent Variable | Controlled Variable |
| 1. | Relationship between the rotating knob of a tap and the rate of flow of the water | Magnitude of rotation of knob (in degree) | Amount of water flow per minute (in liters) | Water Pressure |
| 2. | Relationship of electricity and magnetism in a solenoid | Amount of electric current (in amperes) | Number of pinsattracted by the electromagnet | Number of turns in the solenoid, size of the pin |
| 3. | Effect of heat on the solubility of sugar | Temperature of water (in degree celsius) | Amount of completely dissolved sugar in water (in grams) | Amount of water ( always 100 grams) |
| 4. | The immediate effect of physical exercise on the heartbeat | Duration of physical exercise (in minutes) | Number of Heartbeats | Types of physical exercise, the interval between the end of exercise , and count of heartbeats |
Things to be Considered About Variables
- An experiment or study should have just one independent variable.
- A single dependent variable is all that is needed for an experiment or study.
- Other than the independent and dependent variables mentioned, other variables need to be under control.
- Typically, the independent variable is written on the right side of the equation and the dependent variable is written on the left when expressing the relationship between the variables. As a result, the dependent variable is often referred to as the left variable and the independent variable as the right variable. For instance, the mathematical equation describing the relationship between a moving object and its distance traveled over time is s = vt. Where distance traveled (s) is the dependent variable, time (t) is the independent variable and speed (v) is the controlled variable.
- When displaying the relationship between variables on a graph, the independent variable is always displayed on the horizontal line, or the x-axis, and the dependent variable is always displayed on the y-axis, or the vertical line.As a result, the independent variable is often referred to as the horizontal variable, or the x-variable, and the dependent variable as the vertical variable, or the y-variable.The way a graph is presented always shows how a change in the independent variable affects the dependent variable.
Things to remember title
- Physical conditions, experiments, hypotheses, models, and data are all part of a scientific investigation.
- The variable that a researcher can control is referred to as an independent variable. Independent variables are the experiment's causative factors.
- A dependent variable is one whose value is dependent on the value of another and whose value the experimenter is unable to directly predict or ascertain.
- Controlled variables are those that are kept under strict control during a study or experiment.
- There are causes and effects to every adjustment or event.
- When displaying the relationship between variables on a graph, the independent variable is always displayed on the horizontal line, or the x-axis, and the dependent variable is always displayed on the y-axis, or the vertical line.
© 2021 Saralmind. All Rights Reserved.
 Login with google