Electrocardiogram (ECG)
Subject: Medical and Surgical Nursing I (Theory)

Overview
The electrical activity of the cardiac muscles is represented graphically by an electrocardiogram (ECG), which is composed of a number of waves and complexes. An ECG records electrical activity at a rate of 25 mm/sec and reflects the electrical activity of heart cells. Vertical and horizontal squares on an ECG strip correspond to voltage and seconds, respectively.
- The best method for identifying heart arrhythmias
- Aids in the detection of electrolyte imbalances (hyper- & hypokalemia)
- Enables the detection of aberrant conduction
- A method for detecting ischemic heart disease when doing stress testing
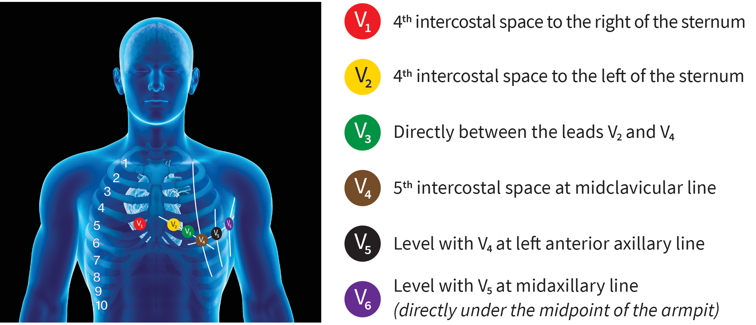
Standard 12 lead ECG
As the heart depolarizes and repolarizes, the ECG trace shows the net electrical activity of the atria and ventricles. Subsequently, the electrical currents that are flowing through the heart are carried to the skin's surface. Electrodes can pick up this current, which can then be measured once they surface.
In order to record the electrical activity of the heart, ECGs use a 12-lead system with 12 points of reference. This can be thought of as 12 separate perspectives on the heart, taken from both the horizontal and vertical axes. The three standard limb leads (I, II, and III), the three augmented limb leads (aVR, aVL, and aVF), and the six precordial leads make up the 12-lead ECG. The heart can be seen in two different planes: a frontal one with six limb leads and a horizontal one with six precordial leads.
Intervals, Segments and Normal Values
- 60 to 100 beats per minute
- PR Interval: The time between the beginning of the P wave and the beginning of the QRS complex. The usual range is 0.12 to 0.20 s.
- Males and females have different QT intervals of 0.40 and 0.44 seconds, respectively, between the beginning of the QRS complex and the conclusion of the T wave.
- QRS Interval: The distance separating the complex's beginning and ending ST Segment: The time between the end of the QRS complex (1 point) and the beginning of the T. The average value is 0.12 seconds.
- P wave terminal negative deflection (in lead V1) = 1 mV * P wave amplitude (in lead II) = 3 mV (mm) (mm)
- Q wave in the same lead with amplitude 1/3 of R wave and 0.04 s (1 mm)
Nursing Interventions
- To the patient: Describe the procedure
- Maintain a suitable setting and your privacy.
- Take off all of the patient's jewelry and metal objects.
- Only the necessary patient section was exposed.
- Tell the patient to stay still while being treated.
- Apply the jelly to the appropriate spot after cleaning the electrode placement region with NS or spirit.
- Make that the ECG machine is plugged in and operating as instructed before taking the ECG strip.
- When using a single channel ECG equipment, take sequential recordings of all limb and chest leads.
- Consider using a longer strip at lead II if there is arrhythmia.
- Disconnect the electrodes and leads after taking the ECG.
- Clear the patient's skin of the conductive gel.
- On the ECG strip, note the patient's name, the date, the time, and the lead level.
- Replace the electrode after cleaning it with a spirit wipe.
Things to remember
© 2021 Saralmind. All Rights Reserved.
 Login with google